
Luis at
6,000 Years of History Visualized in a 23-Foot-Long Timeline of World History, Created in 1871
♲ Ted MillsSo that's where the 6K number came from.
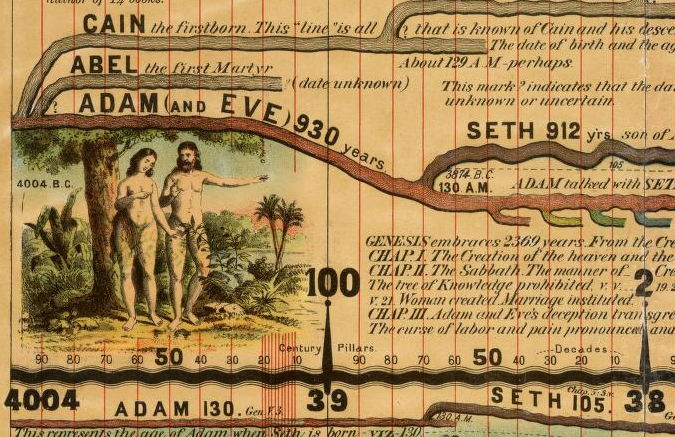
A beautiful early example of visualizing the flow of history, Sebastian C. Adams’ Synchronological Chart of Universal History outlines the evolution of mankind from Adam and Eve to 1871, the year of its first edition.
A recreation can be found and closely examined at the David Rumsey Map Collection, which allows you to zoom in on any part of the original timeline, which stretched to 23 feet in length and was designed for schoolhouses as a one-stop shop for all of history.
As Daniel Rosenberg and Anthony Grafton describe it in their book Cartographies of Time:
The Synchronological Chart is a great work of outsider thinking and a template for autodidact study; it attempts to rise above the station of a mere historical summary and to draw a picture of history rich enough to serve as a textbook in itself.
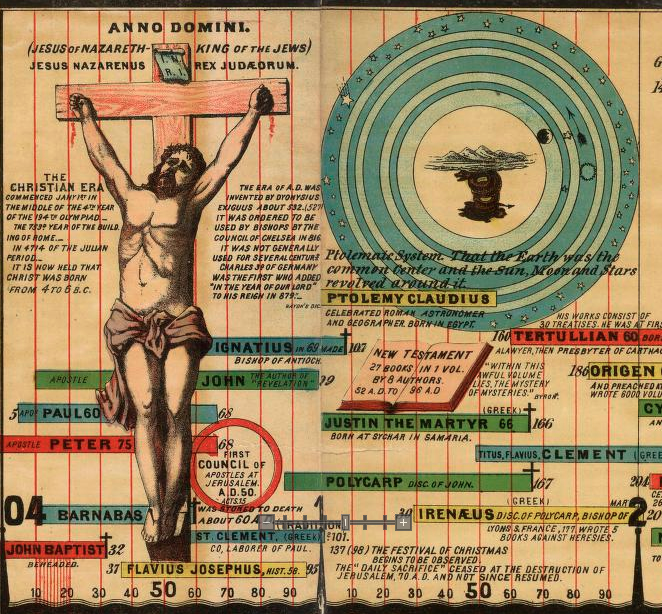
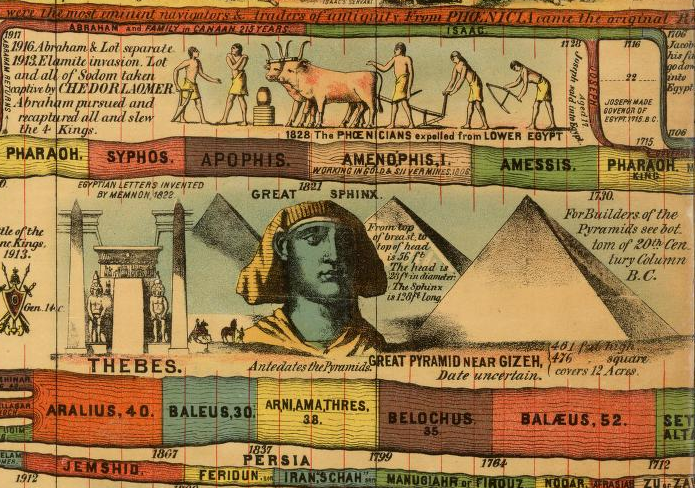
Adams was a voracious reader and a good Christian, and in the top half of the chart he attempts to untangle the spaghetti-like genealogy of Adam and Eve’s children from Abel (“The First Martyr”) through to Solomon (whose temple looks very Gothic), all the way through to Jesus and beyond. At the same time he presents a detailed description of archaeological history “after the flood,” from Stone Age tools through the earliest civilizations, mentioning major battles, inventions, philosophers, and advances in science. Adams’ starting date of all history comes from the Irish Archbishop James Ussher, who, in 1654 declared after years of study that the earth was created on “nightfall on 22 October 4004 BC.” (Now that’s certainty!)
The map is colorful and filled with beautiful illustrations from the self-taught Adams, from a drawing of Nebuchadnezzar’s Dream to the current world leaders and a list of United States Presidents up to James Garfield. There’s even a section at the far end for “Eminent Men not elsewhere mentioned on the Chart,” the sign of a true completist (except for the part where he leaves out women).

Adams lived far from the epicenters of American education. He grew up in a Presbyterian family in Ohio, and, when he showed a skill for teaching later in life, he made the trek out west, nearly dying on the Oregon Trail. He settled in Salem, Oregon and began teaching while also working on his chart. When it was ready to print, he traveled back to Cincinnati to hire the esteemed lithographers Strobridge & Co., who published Civil War scenes, maps, and circus posters. Initially he sold the chart himself, but its popularity led to several American and British printers producing copies into the 20th century. Even Horror writer H.P. Lovecraft owned a copy.

It remains a riotous work of art, history, religion, and self-determination, and facsimiles can still be purchased online. Adams later left teaching to become president of an insurance company, and died of “la grippe” (i.e. the flu) in 1898.
via Kottke
Related content:
New York Public Library Puts 20,000 Hi-Res Maps Online & Makes Them Free to Download and Use
An Interactive Map of Odysseus’ 10-Year Journey in Homer’s Odyssey
5-Minute Animation Maps 2,600 Years of Western Cultural History
Ted Mills is a freelance writer on the arts who currently hosts the FunkZone Podcast. You can also follow him on Twitter at @tedmills, read his other arts writing at tedmills.com and/or watch his films https://vimeo.com/user749601 .
Link to Open Culture
#art #history
FLWNQWUD, Claes Wallin (韋嘉誠), Freemor, jrobertson likes this.
Claes Wallin (韋嘉誠), Claes Wallin (韋嘉誠), Claes Wallin (韋嘉誠), Claes Wallin (韋嘉誠) and 1 others shared this.
amazing!