
The Vizard
I have lots and lots and lots of problems with this graph. Can you name a few?
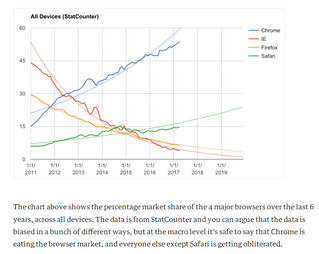
I do find it misleading to draw those curves as fits for that data since at any given point in time the sum of all those percentages must be <= 100. It looks like than in a year or two that Chrome and Safari will have captured more than 100% of the market. I have some other observations and responses to the blog post that graph is from, but they aren't necessarily happy ones.
>> Charles ☕ Stanhope:
“I do find it misleading to draw those curves as fits for that data since at any given point in time the sum of all those percentages must be <= 100”
Exactly, I think the same